 Image: Cassandra Bongiovanni, Heather A. Stewart and Alan J. Jamieson (CC BY 4.0)
How much of the seafloor have we mapped?
Every map of the ocean floor you have seen shows the whole thing: ridges, trenches, the long rise of the continental slopes, in colours from shallow blue to deep purple. The picture is real, but only about a quarter of it was measured. The rest is inferred from the shape of the sea surface, seen by satellite, at a resolution of several kilometres. The Seabed 2030 project, which keeps the count, put the fraction of the seafloor mapped by direct sonar measurement at 28.7 per cent in 2026. In 2017, when the project started, it was about 6 per cent.
How a ship maps the bottom
A multibeam echo sounder under a ship's hull sends out a fan of sound pulses across the track and times the echoes from the bottom. From the travel time and the speed of sound in seawater, about 1,500 m per second, it computes the depth at a few hundred points across a swath on every ping, and as the ship moves forward the swaths join into a strip of measured seafloor. The width of the strip depends on the depth. In water 4,000 m deep the usable swath is roughly three to four times the depth, 12 to 16 km, and each depth point stands for a cell of 50 to 100 m across. In shallow water the swath narrows to a few times the depth, which in 50 m of water is a strip a few hundred metres wide.
Why it takes so long
Take a ship mapping the abyssal plain at 4,000 m with a swath of 12 km, steaming at 10 knots, about 18.5 km per hour. In one hour it maps a strip 18.5 km long and 12 km wide, 222 km². In a day of continuous work that is about 5,300 km². The ocean's area is 361 million km², so one ship would need about 68,000 days, or 186 years, to cover it once, with no time for port calls, weather, or the slow going in shallow water where the swath shrinks. Estimates by the GEBCO community for mapping the whole seafloor with a fleet of ships at this standard come to about 200 ship-years and several billion dollars. It is a large job and not an impossible one, which is the point the project makes.
Most of the mapped quarter was not mapped for the sake of mapping. It is the record of ships going somewhere else with their sounders switched on, of surveys for cables and shipping lanes, of national programmes mapping their own continental shelves, and of research cruises crossing an ocean to reach a study site. Seabed 2030 collects those records, which were scattered across hundreds of institutions, into a single grid that the General Bathymetric Chart of the Oceans publishes free each year.
What the satellites see
The purple and blue map of the whole ocean comes from radar altimetry. A satellite measures its height above the sea surface to a few centimetres, and the surface is not flat: the extra gravitational pull of an undersea mountain draws water towards it and raises the surface above it by a metre or two, while a trench lowers it. Walter Smith and David Sandwell showed in 1997 that this signal, combined with the sparse ship soundings available, could be turned into a global map of the seafloor. The resolution is limited by the physics of how gravity smooths out with distance from its source. Features narrower than about 6 to 10 km do not show up, and a seamount a kilometre high and a few kilometres wide, the size of a Welsh mountain, can be missing altogether. A 2023 survey of the altimetry data found about 19,000 seamounts that had never been catalogued, and the total is now put at more than 40,000.
The newest altimetry mission, SWOT, launched in December 2022, measures the sea surface in two dimensions rather than along a line, and its early results are sharpening the gravity map to features of a few kilometres. It will not replace the ships, because gravity cannot tell a smooth hill from a rough one, and it is the roughness, the ridges and the cliffs, where most of the life is.
Why it matters for biology
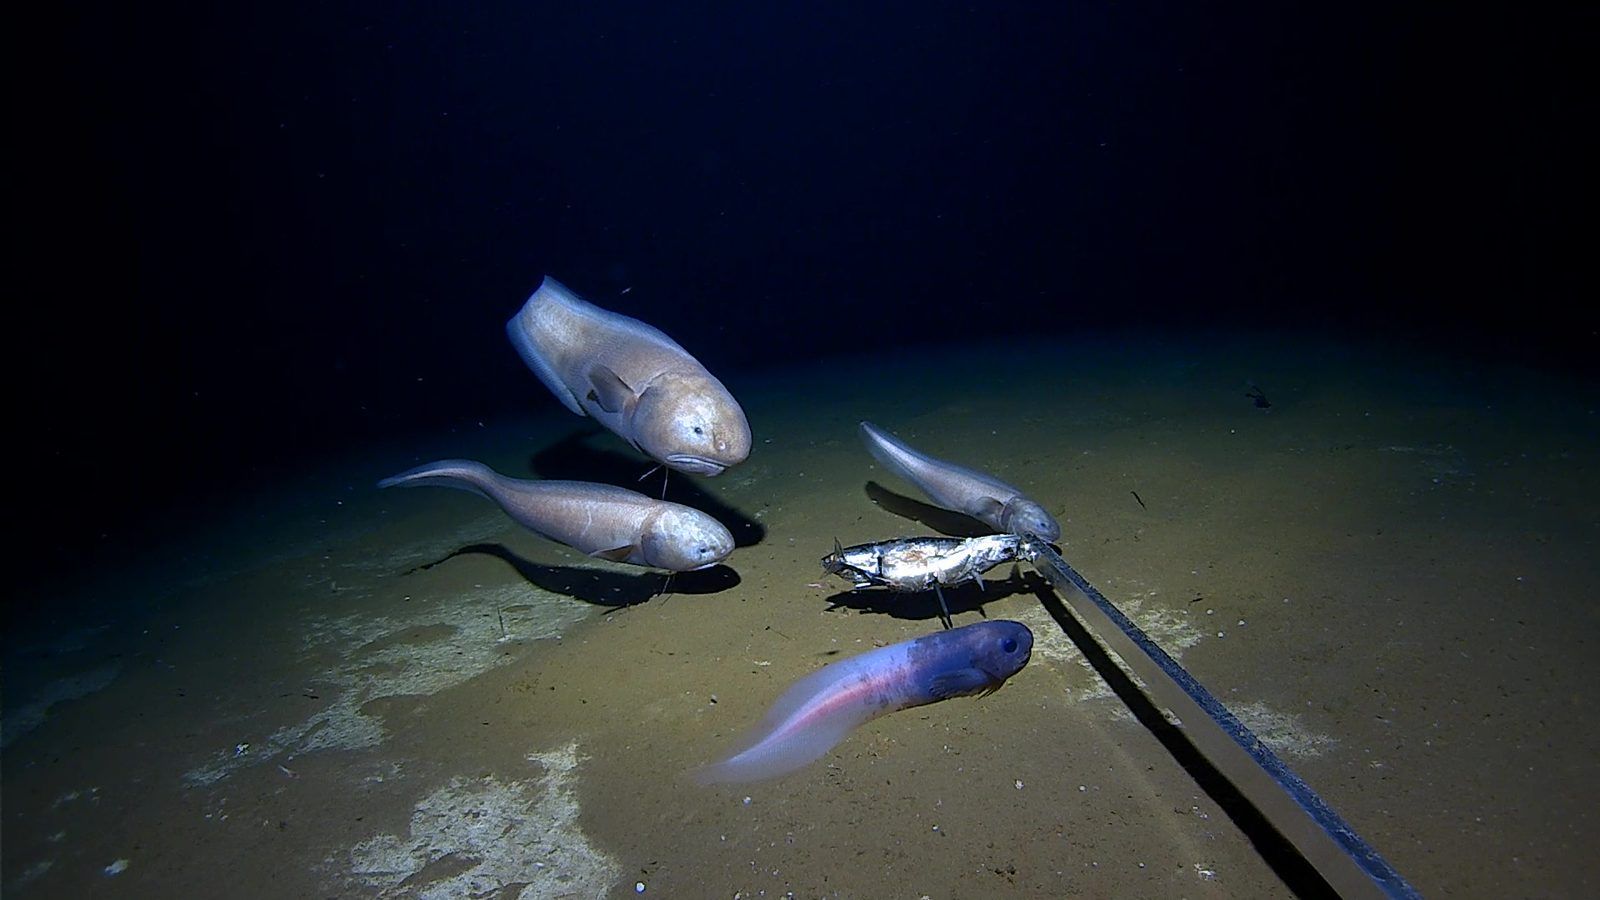
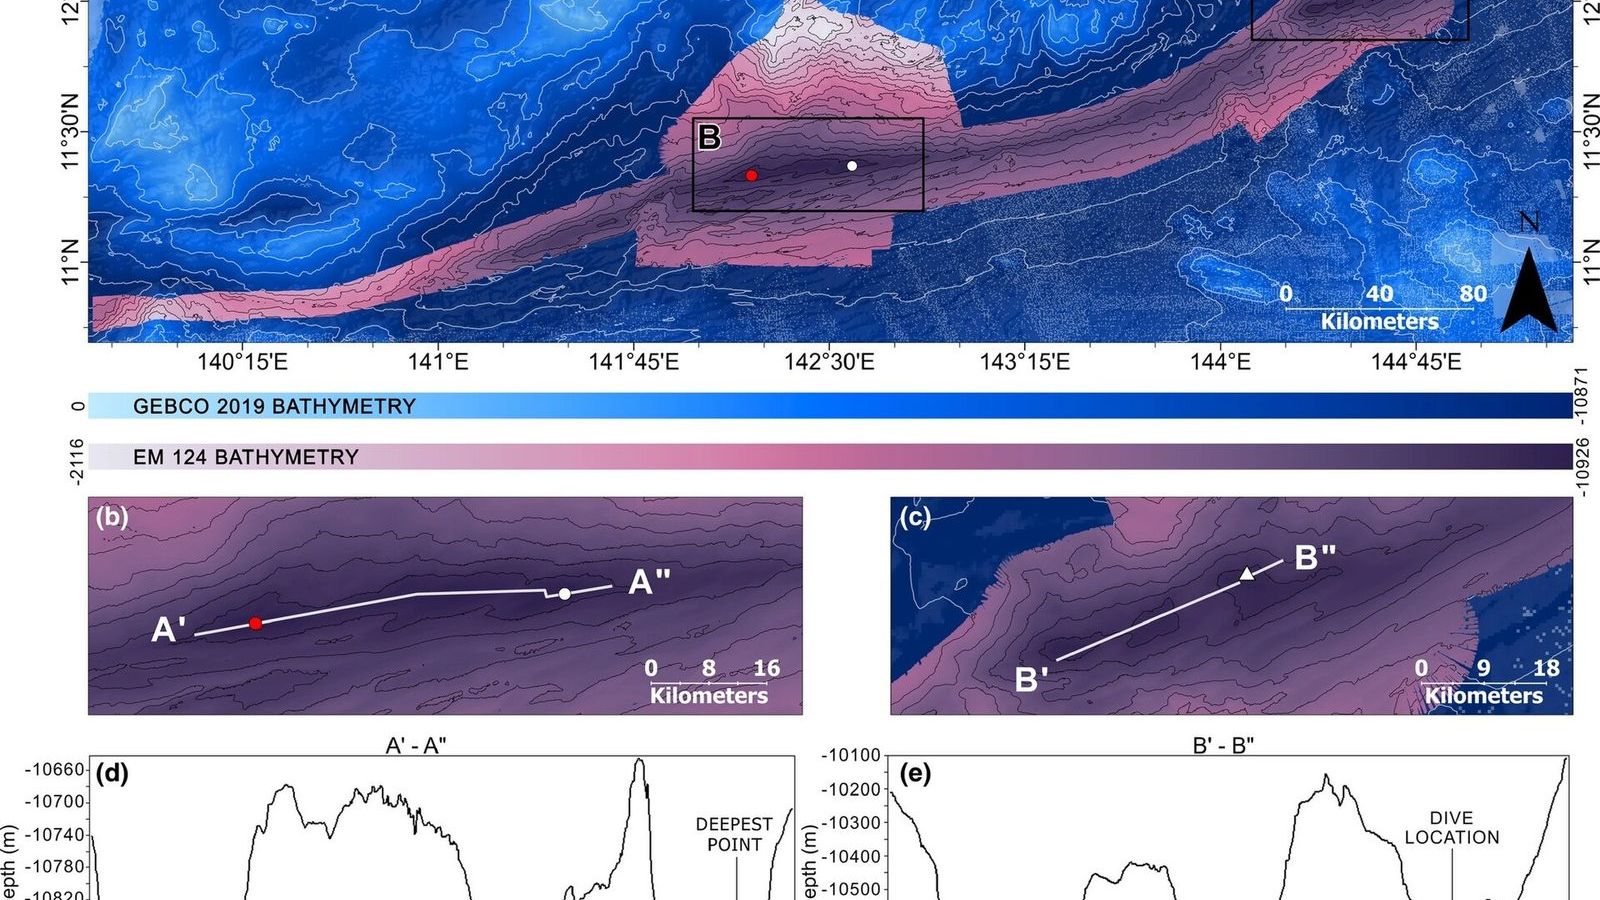
A marine biologist needs the map for the same reason a land biologist needs a topographic one. Seamounts concentrate currents and plankton and are the places where deep-sea corals, sponges, and the fish that live among them are found, and most seamounts have never been visited. Canyons funnel sediment and food down the continental slope. The trenches, the cold seeps, the mid-ocean ridges where the vents are, the nodule fields that mining companies want, all have to be found before they can be studied or protected. Every one of the record-breaking discoveries in Unit 15, the deepest fish and the deepest point of the ocean among them, was made possible by a multibeam survey that showed where to send the lander. The depth of the Challenger Deep itself, 10,935 m with an uncertainty of 6 m, was fixed only in 2021, by combining the best multibeam data with direct pressure measurements from the bottom.
The comparison with Mars is made so often that it is worth getting right. The whole surface of Mars has been mapped from orbit at a resolution of a few hundred metres and in places at a few metres, and so has the Moon. The ocean floor is better known than Mars in the quarter that ships have covered and far worse in the rest, because there is 4 km of water in the way, and water stops radar and light within a few hundred metres. Sound is the only thing that goes through it, and sound has to be sent from a ship.
Unit 16 of the Marine Biology Masterclass covers the tools of deep-sea exploration, from multibeam sonar and landers to the full-ocean-depth submersibles, the molecular tools, deep-sea mining, and the High Seas Treaty, with the ship-day calculation above as a worked example and GEBCO as the week's tool of Unit 15. Unit 1 introduces the ocean's dimensions. The full outline is in the curriculum.