 Image: ENERGY.GOV (public domain)
How scientists count fish they cannot see
On 2 July 1992 the Canadian fisheries minister closed the northern cod fishery off Newfoundland and Labrador, the largest cod fishery in the world for four centuries, and put about 30,000 people out of work in a single announcement. Two years earlier the official assessment had put the stock at a level that could support a catch of nearly 200,000 tonnes. The fish were not there. How a scientific agency with research ships, decades of data, and a staff of biologists could be that wrong is the question every fisheries student is made to answer, and the answer begins with how fish are counted in the first place.
Three ways to estimate a number you cannot see
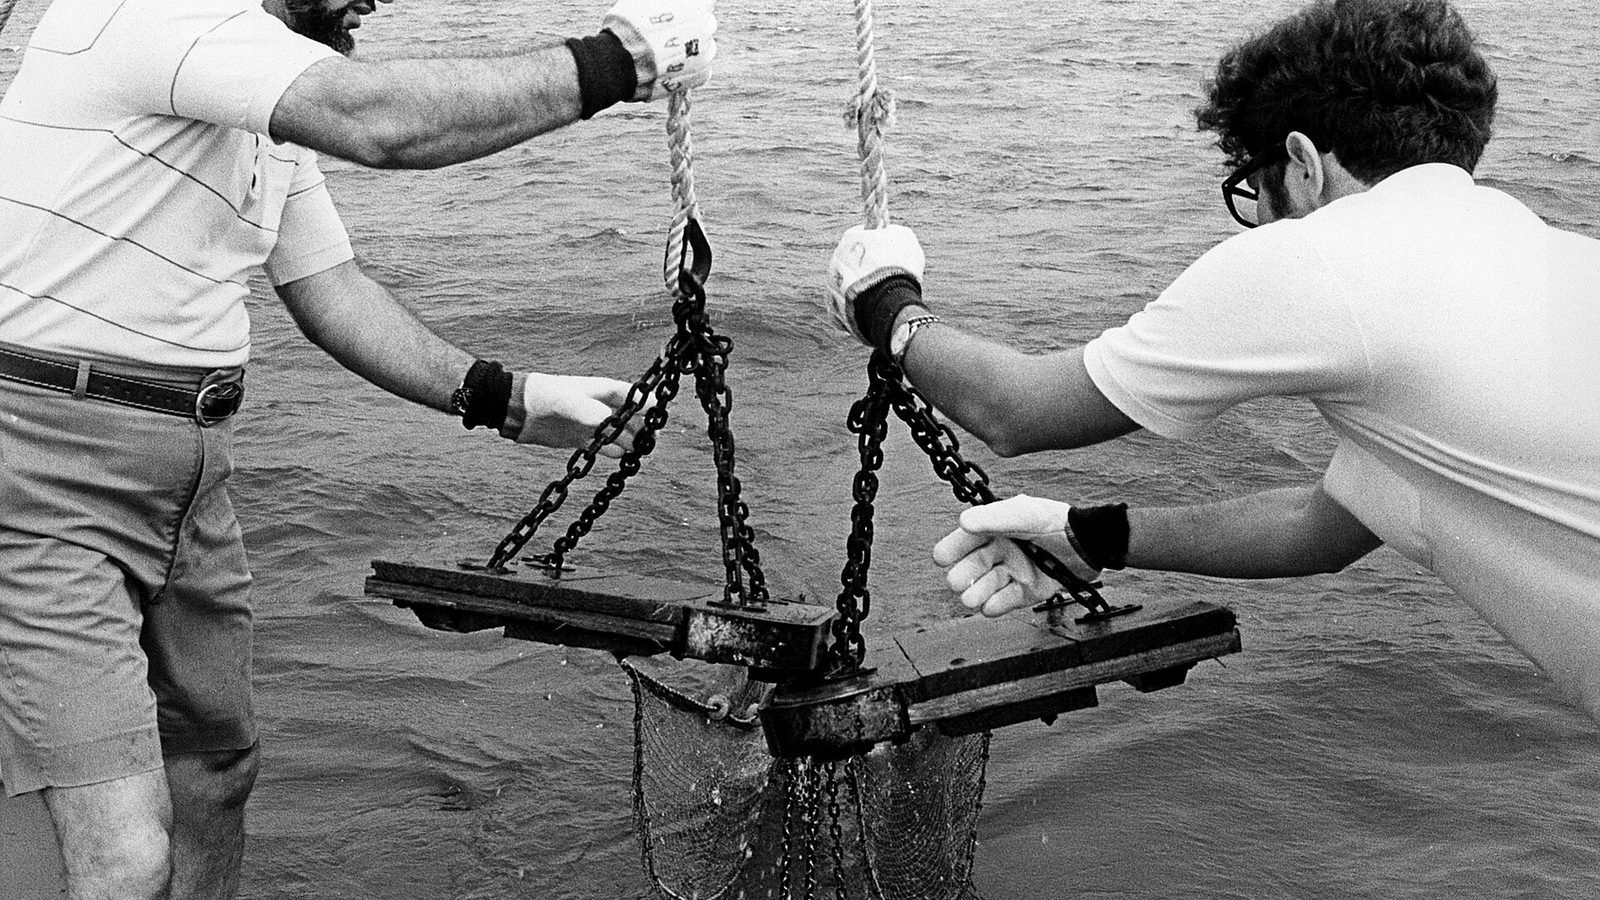
The direct method is a research survey. A ship tows a standard net at fixed stations across the stock's range, every year, in the same season, and the catch per station is converted to fish per square kilometre and summed. The estimate is noisy, because fish are patchy and a net catches only a fraction of what it passes over, but the bias is the same from year to year, so the trend is reliable even when the absolute number is not. Acoustic surveys do the same with sonar for fish that school in midwater, such as herring and anchovy, and the echo strength is converted to tonnes.
The second method uses the fishery itself. If a fleet catches more fish per hour of fishing this year than last, there are presumably more fish. The catch per unit effort is cheap, it comes from every boat, and it covers the whole range of the stock. Its weakness is the assumption that a unit of effort catches a constant fraction of the fish. It does not. Boats get better at finding fish every year, with new sonar, new positioning systems, and shared knowledge of where the fish are. A stock that is shrinking can keep yielding the same catch per hour for years because the fleet is concentrating on the last dense schools. This failure mode has a name, hyperstability, and it is the trap of this post's title.
The third method is a model that combines both. An age-structured assessment takes the catches of each age of fish in each year, adds the survey indices, and reconstructs how many fish there must have been in each year class to produce those catches, given a natural death rate. Done well, it gives the size of the stock, the rate at which it is being fished, and a forecast. Done with biased inputs, it gives a confident wrong answer.
What went wrong with the cod
The northern cod was fished heavily by foreign trawlers in the 1960s, with a peak catch of about 810,000 tonnes in 1968, and the stock fell steeply. After Canada extended its waters to 200 nautical miles in 1977 the foreign fleets left, the catch per hour of the Canadian trawlers rose, and the assessments reported a stock that was recovering. The quotas were set accordingly, at around 250,000 tonnes a year through the 1980s.
The recovery was in large part an artefact. The offshore trawlers were catching well because they had found the dense spawning aggregations the cod form in winter, and the catch rates from those aggregations were feeding into the assessment as evidence of abundance. Inshore fishers, whose traps and lines caught fewer fish every year, said so, and were not believed. When the research surveys began to disagree with the commercial data in the late 1980s, the assessment weighted the commercial data. By 1992 the survey biomass of adult cod had fallen by more than 95 per cent from the early 1980s, and in two years the estimated spawning stock went from hundreds of thousands of tonnes to almost nothing.
The moratorium that was expected to last two years lasted for 32. The stock stayed low for decades, for reasons that are still argued over, among them a cold period in the early 1990s, the collapse of the capelin the cod feed on, and the loss of the oldest, most fecund fish. Canada reopened a small commercial fishery for northern cod in 2024, with a quota of 18,000 tonnes, less than a tenth of the catches of the 1980s. Fisheries and Oceans Canada publishes the current assessments on its website.
A worked example of hyperstability
Suppose a stock of 100 schools, each of 1,000 tonnes, is fished by a fleet that can find and catch one school per trip. The catch per trip is 1,000 tonnes. Now suppose the stock falls to 20 schools of the same size. A fleet with good sonar still finds one school per trip, and the catch per trip is still 1,000 tonnes. The index has not moved while the stock has lost 80 per cent of its mass. Only when the schools themselves start to shrink, or when trips begin to come back empty, does the index fall, and by then the stock is at a fraction of its size. Unit 12 of the masterclass runs this calculation with a schooling fish and then with a stock whose catch is held constant above its sustainable yield, year by year, until it is gone.
The global count
The same problem exists at the scale of the planet. The Food and Agriculture Organization of the United Nations compiles the catch that each country reports, and the world total has sat at 80 to 90 million tonnes for about thirty years, which looks like stability. In 2016 Daniel Pauly and Dirk Zeller of the Sea Around Us project published a reconstruction in Nature Communications that added the catches countries do not report: small-scale fisheries, recreational catches, discards, and illegal fishing. Their estimate peaked at about 130 million tonnes in 1996, half again as much as the reported figure for that year, and has fallen since by about 1.2 million tonnes a year. The reported numbers look flat because the gaps in them have been closing while the real catch declined. The reconstructed data for every country are free to explore on the Sea Around Us website, which is the weekly tool of Unit 12 in the reserve list.
The FAO's own State of World Fisheries and Aquaculture report for 2024 classified 37.7 per cent of the assessed stocks as fished beyond sustainable limits, up from about 10 per cent in 1974. The other 62 per cent are within sustainable limits, and most of those are fished at close to their maximum. Aquaculture now produces more aquatic animals than capture fisheries, which is one of the reasons the catch has not fallen further.
What a good assessment looks like
The lessons of 1992 are written into most assessments today. Survey data are weighted above commercial catch rates. Reference points are set with a buffer below the maximum sustainable yield rather than at it, because the yield is a ceiling and not a target. Uncertainty is reported as a range, not a number, and a precautionary rule reduces the quota automatically when the stock falls below a threshold. The fisheries that follow these rules, in Alaska, Iceland, Norway, New Zealand, and increasingly in the European Union, have stocks that are stable or growing. The ones that do not are the ones that make the news.
Unit 12 of the Marine Biology Masterclass covers population dynamics, the logistic model and maximum sustainable yield, stock assessment, the cod collapse, fishing down the food web, and marine reserves, with Pauly's reconstruction as a research spotlight. Unit 8 gives the food-web arithmetic that sets how much fish a sea can produce. The full outline is in the curriculum.