 Image: Olivier Dugornay (CC BY 4.0)
How deep does sunlight go in the sea?
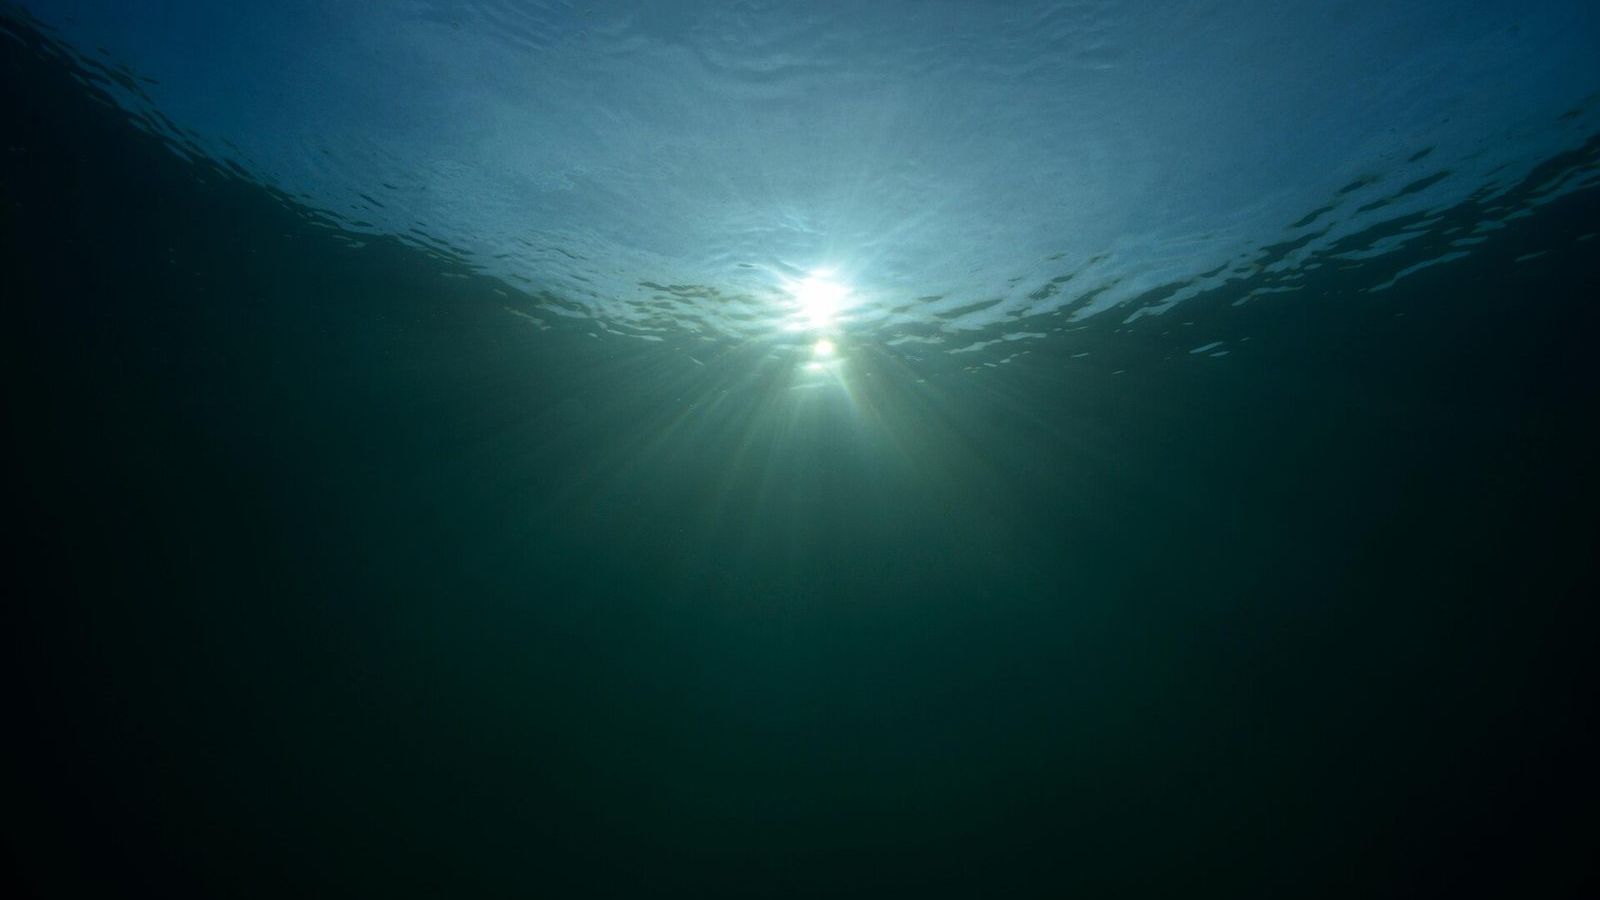
Divers notice it within the first ten metres. A cut on the hand bleeds green. A red wetsuit turns brown, then black. By 30 metres the world is blue and grey, and a torch brings the colours back as if someone had switched them on. What the diver is watching is the absorption of light by water, one wavelength at a time, and it follows a law simple enough to use with a pocket calculator.
The law
Light that enters the sea is absorbed by the water itself, by dissolved substances, and by the particles suspended in it, and it is scattered by all three. The combined effect is that a fixed fraction of the light is lost in each metre of depth. If 10 per cent is lost in the first metre, then 10 per cent of what remains is lost in the second, and so on. The light at depth \(z\) is therefore
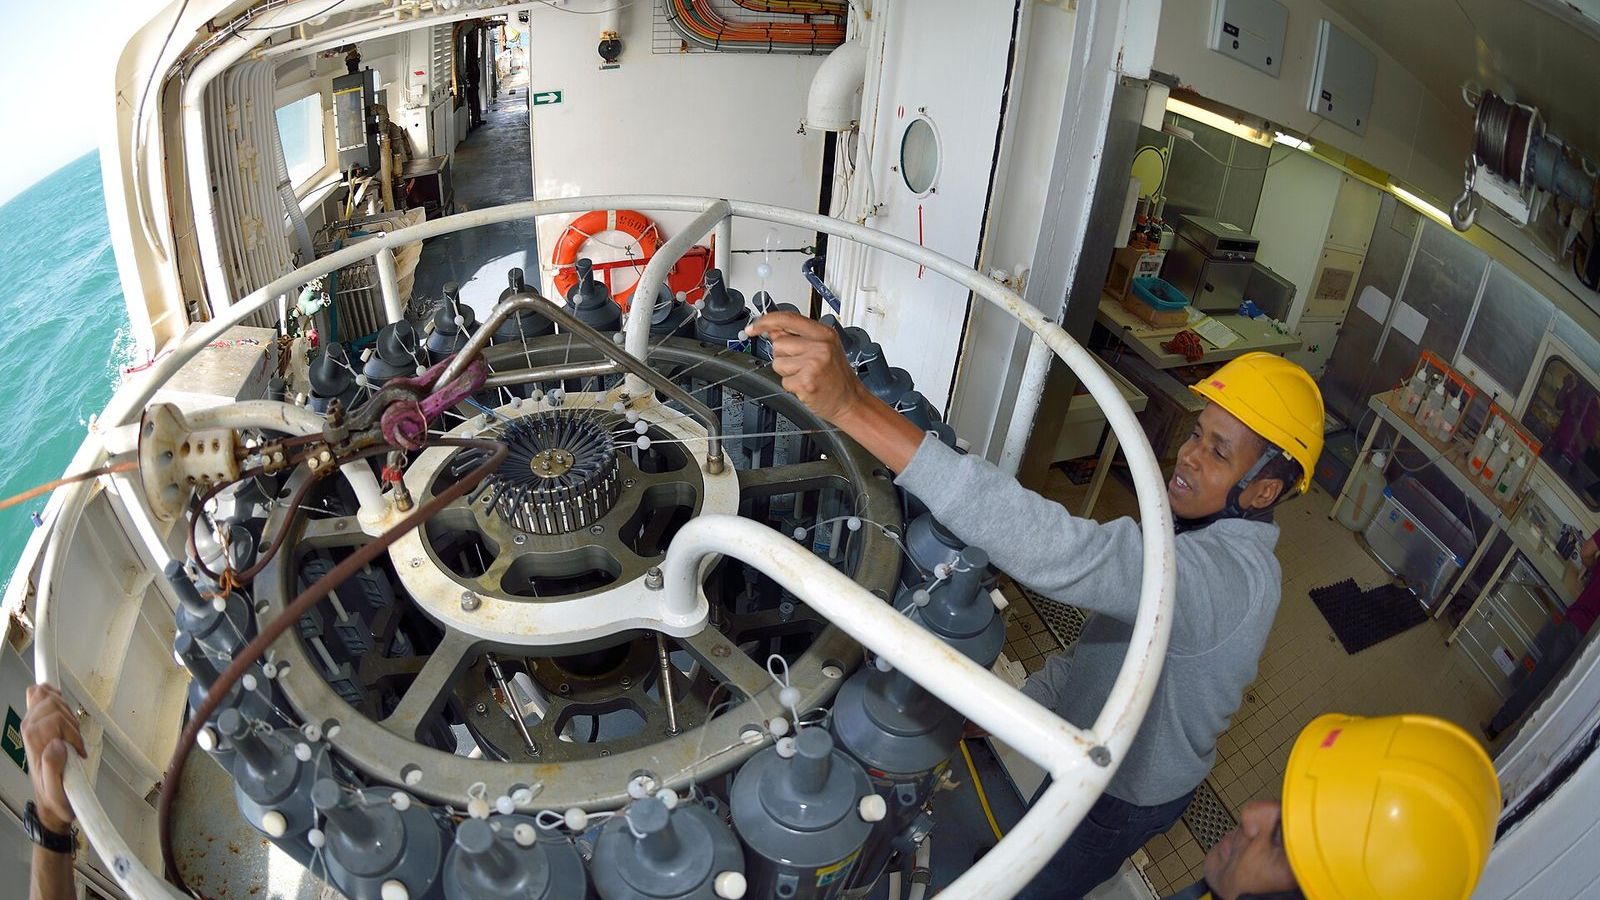
\[ E(z) = E_0\, e^{-K_d z} \]where \(E_0\) is the light just below the surface and \(K_d\) is the diffuse attenuation coefficient, measured in inverse metres. This is the Beer-Lambert law, the same relation that chemists use when they measure the concentration of a solution by the light it absorbs. Everything about the underwater light field that matters to a biologist is contained in that one number \(K_d\), and oceanographers measure it on every cruise by lowering a light sensor and reading the irradiance at a series of depths.
Biologists care most about the depth where 1 per cent of the surface light remains, because near that depth, roughly speaking, a phytoplankton cell uses as much energy in respiration as it gains from photosynthesis. The layer above it is the euphotic zone, the part of the ocean where plants can grow. Setting \(E(z)/E_0 = 0.01\) and solving gives
\[ z_{1\%} = \frac{\ln 100}{K_d} \approx \frac{4.6}{K_d}. \]Three real numbers
In the clearest open-ocean water, the kind found in the middle of the subtropical gyres, \(K_d\) for the photosynthetically useful part of the spectrum is about 0.04 per metre. The 1 per cent depth is then 4.6 divided by 0.04, which is 115 metres. In typical coastal water, with more plankton and some river-borne material, \(K_d\) is about 0.2 per metre and the 1 per cent depth is 23 metres. In a turbid estuary at the mouth of a large river, \(K_d\) can reach 1.0 per metre or more, and 1 per cent of the light is gone at 4.6 metres. A diver in such water cannot see their own fins.
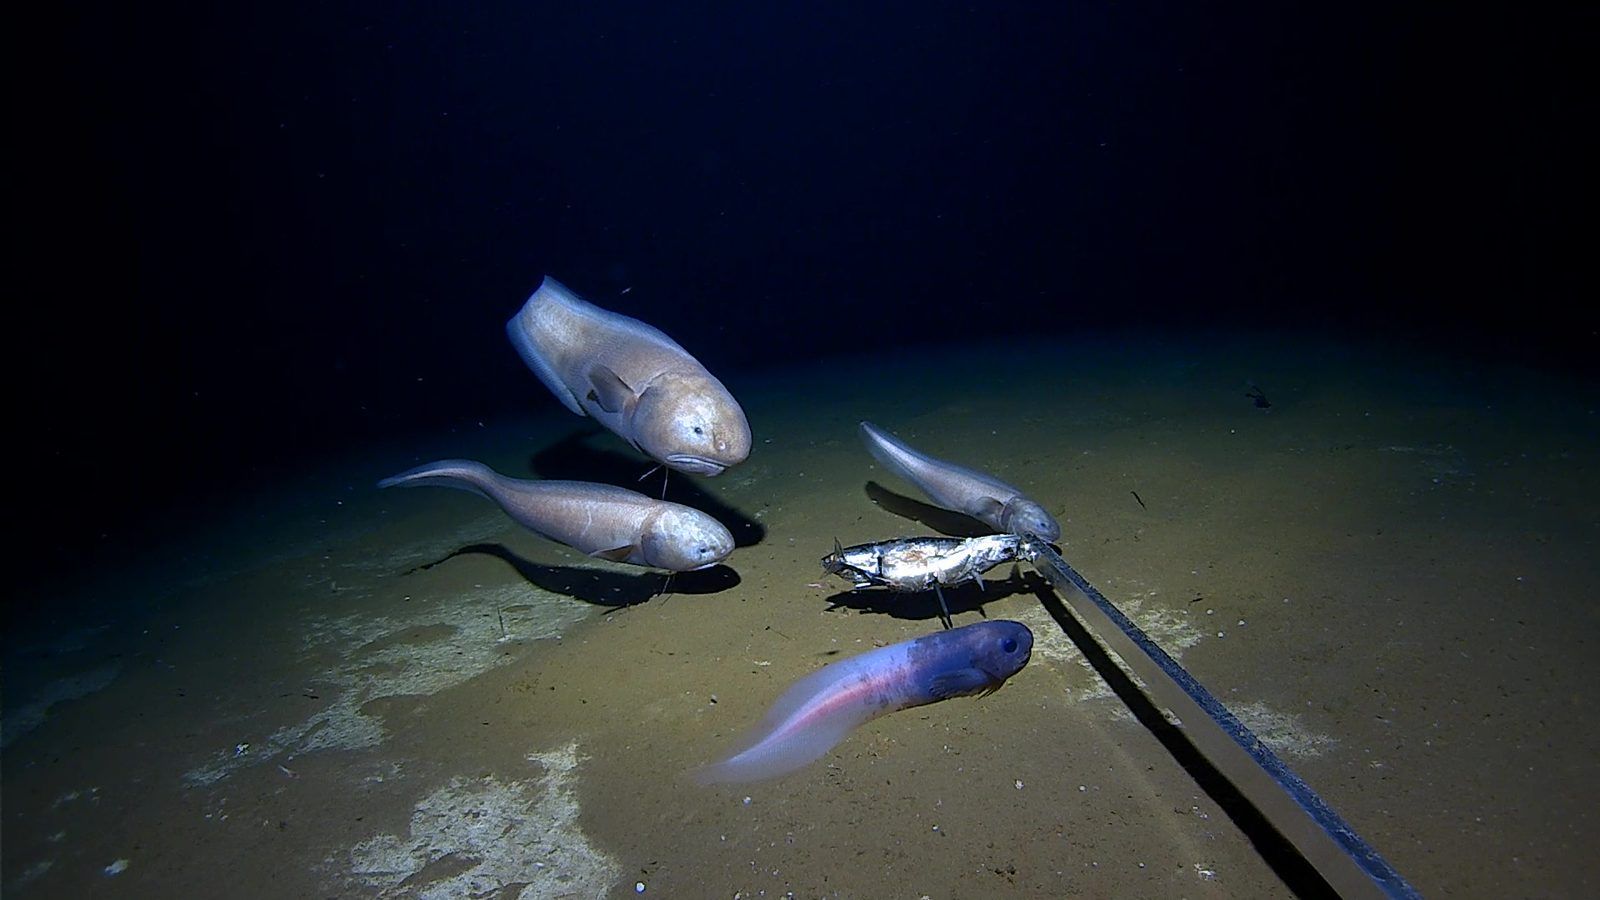
The same law tells you what is left at any other depth. In the clearest water, at 200 metres, the boundary between the sunlit and the twilight zones, the exponent is 0.04 times 200, which is 8, and \(e^{-8}\) is about 0.0003. Three hundredths of a per cent of the surface light remains. That is still enough for the eyes of a lanternfish. At 1,000 metres the exponent is 40 and the fraction is \(e^{-40}\), roughly \(4 \times 10^{-18}\). For all practical purposes the sunlight has ended, and the only light below is made by animals.
The usual rule of thumb says that the euphotic zone ends at 100 to 200 metres in the open ocean. The calculation shows why: it depends on the water, and the clearest water gives the deepest value. Measurements with sensitive instruments find that a little photosynthesis continues below the 1 per cent depth, down to about 0.1 per cent of the surface light, so the 1 per cent rule is a convention rather than a physical boundary. It is the convention everybody uses, which is why the number is worth knowing.
Why the sea is blue
The single coefficient hides a spectrum. Pure water absorbs red light far more strongly than blue. At a wavelength of 680 nanometres, the red that chlorophyll absorbs, the absorption coefficient of pure water is about 0.45 per metre; at 450 nanometres, in the blue, it is about 0.01 per metre, more than forty times less. So red light is reduced to 1 per cent within about ten metres, while blue light in clear water reaches 1 per cent only below a hundred metres. The sea is blue for the same reason a thick pane of glass looks faintly green: the water itself removes the other colours. In coastal water the picture shifts, because dissolved organic matter from rivers absorbs blue strongly, and the light that penetrates best becomes green or yellow.
The diver's bleeding hand is this spectrum in action. At 20 metres the red light from the surface has largely gone, and blood, which reflects red, has nothing red to reflect. Under a torch, which supplies all wavelengths, the blood is red again.
What this means for life
Phytoplankton have arranged their pigments around the light that reaches them. Near the surface the green algae and the cyanobacteria use chlorophyll, which absorbs red and blue. Deeper down the light is blue-green, and organisms that live there add pigments that catch those wavelengths: the phycobilins of some cyanobacteria and red algae, the carotenoids of diatoms. The smallest and most abundant photosynthetic cell in the sea, Prochlorococcus, comes in a high-light form that lives in the top 50 metres and a low-light form that lives near the bottom of the euphotic zone and carries more pigment per cell to make use of the dim blue that reaches it.
The attenuation of light also sets the depth structure of the ocean's zones. The epipelagic zone, from the surface to 200 metres, is where photosynthesis happens. The mesopelagic zone, from 200 to 1,000 metres, has enough light for vision but not for growth, and its animals rise to the surface at night to feed. Below 1,000 metres, in the bathypelagic zone, the darkness is complete. These boundaries, which recur in every description of the deep sea, are nothing more than the Beer-Lambert law applied to clear water.
Measuring it yourself
The oldest instrument for measuring water clarity is a white disc on a rope, first lowered by the astronomer Angelo Secchi from a papal ship in 1865. The depth at which the disc disappears from view is the Secchi depth, and for many waters the 1 per cent light depth is roughly two to three times the Secchi depth. Anyone with a plate, a rope, and a pier can measure it, and coastal observatories have Secchi records going back a century that show how clarity has changed. The free satellite data in NASA Worldview go a step further and show \(K_d\) for the whole ocean, mapped every day from the colour of the water seen from space.
Unit 2 of the Marine Biology Masterclass derives the attenuation law, works through the three examples above, and uses the result in the units on plankton and on the twilight zone. The full list of topics is in the curriculum.