


Marine Microbes and Nutrient Cycles
A millilitre of seawater holds about a million bacteria and ten million viruses, and the ocean holds more microbial cells than there are grains of sand on all its beaches. This unit introduces them by their numbers and their names, from SAR11 and Prochlorococcus to the ammonia-oxidizing archaea of the dark ocean, follows the carbon that passes through them in the microbial loop and the viral shunt, and explains how a cell earns energy from chemistry when there is no light. With that idea it traces the cycles of nitrogen, phosphorus, iron, and silicon, and shows how to read the history of a water sample from its oxygen.
A teaspoon of seawater holds about five million bacteria and fifty million viruses, and the whole ocean holds some \(10^{29}\) microbial cells, which together weigh about twice as much as all the phytoplankton of Unit 3. This unit introduces the microbes of the ocean by their numbers and their names, follows the carbon that passes through them, explains where a cell finds energy when there is no light, and uses that idea to trace the cycles of nitrogen, phosphorus, iron, and silicon.
1 The microbial ocean by numbers
A millilitre of surface seawater holds roughly a million cells of bacteria and archaea, about ten million viruses, around a thousand small flagellates, single-celled eaters of bacteria that Section 2 introduces, a few of the larger ciliates, and, in warm water, up to a hundred thousand cells of the smallest photosynthesizers. In the deep sea the numbers fall to a few tens of thousands of bacteria and archaea per millilitre, but the deep sea is large. In 1998, Whitman, Coleman, and Wiebe added up the counts from every depth and arrived at about \(1.2\times10^{29}\) bacterial and archaeal cells in the open ocean, and the viruses are thought to number about \(10^{30}\). The carbon in the ocean’s bacteria and archaea comes to about 2 petagrams, where a petagram is a billion tonnes, which is roughly twice the standing biomass of the phytoplankton given in Unit 3.
These numbers were unknown until the 1970s for one reason, which lies in the method of counting. Until then, bacteria in seawater were counted by spreading a sample on a nutrient agar plate and counting the colonies that grew, and such plates gave a few hundred to a few thousand cells per millilitre. In 1977 Hobbie, Daley, and Jasper collected the cells of a sample on a filter with pores of \(0.2\unit{\mu m}\), stained them with the fluorescent dye acridine orange, which binds DNA and RNA, and counted them under a microscope that lights the sample from above with blue or ultraviolet light, so that each stained cell appears as a bright point on a dark field. This epifluorescence microscopy gave a million cells per millilitre, a thousand times the plate count. The discrepancy was named the great plate count anomaly in 1985. Its explanation is that fewer than one marine cell in a hundred will grow on the nutrient-rich growth media, the jelly in the plates, that were developed for medical laboratories, because most marine microbes are adapted to nutrient concentrations a million times lower, and many of them depend on substances that neighbouring cells supply, which a plate does not. Figure 1 shows what the method reveals.
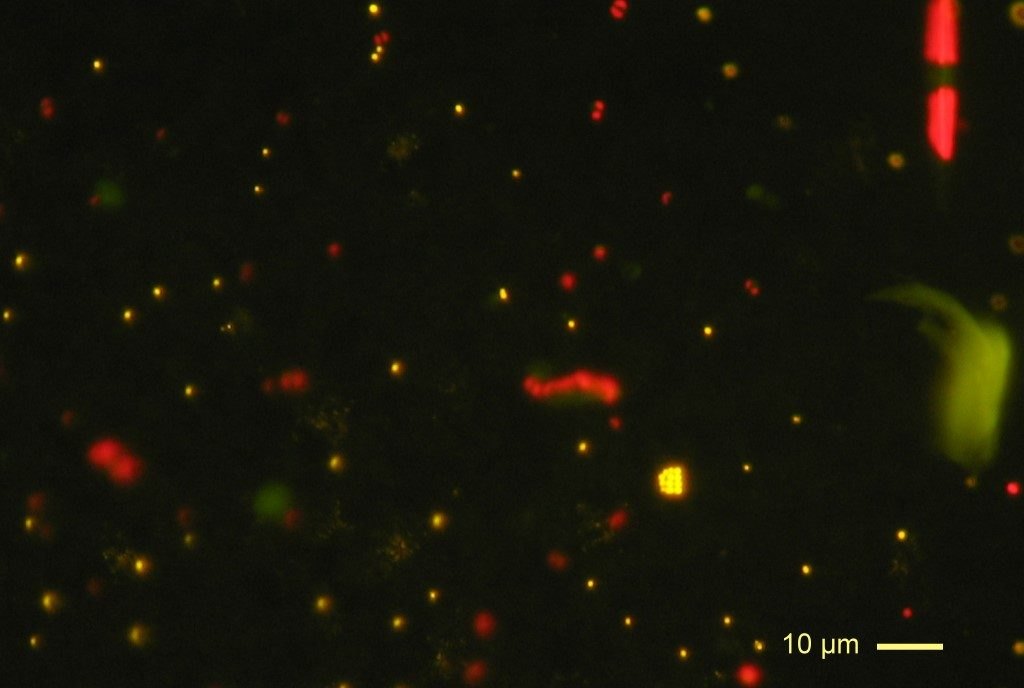
Two further instruments completed the census. The flow cytometer, adopted from medical laboratories in the early 1980s, pushes a thin stream of seawater past a laser beam at about a thousand cells per second. For every cell that crosses the beam it records the light that the cell scatters and the colours in which the cell fluoresces. Chlorophyll fluoresces red, the orange pigment phycoerythrin of Synechococcus fluoresces orange, and cells stained with a DNA dye fluoresce green, so the main groups are told apart and counted in minutes. Viruses are too small for a light microscope to show as separate objects. Bergh and colleagues first counted them in 1989 with an electron microscope, which showed up to 250 million particles per millilitre in natural waters. Since 1998 they are counted with the DNA stain SYBR Green under the epifluorescence microscope, where each virus appears as a faint green point; the particle is far smaller than the microscope can resolve, but its glow is still visible, in the same way that a star appears as a point of light.