


The Ocean as a Living System
The closing unit of the Foundation masterclass joins the plankton, the animals, and the habitats of the first seven units into one working system. It follows the energy from the phytoplankton up the food web and shows why only about a tenth of it survives each step, why the ocean's animals outweigh its plants, and how much fish a sea can produce. It then follows the carbon down, with the marine snow that feeds the deep sea and keeps carbon dioxide out of the air, and ends with the ocean's place in the climate system, the pressures people put on it, and the parts of it that nobody has yet seen.
The first seven units took the ocean apart: the water and the light, the plankton, the invertebrates, the fishes, the mammals and birds, and the shores. This unit puts the pieces back together and asks how the whole works. Energy enters the sea as sunlight caught by the phytoplankton, climbs a food web in which about nine tenths of it is lost at every step, and ends in a tuna, a seal, or a fishing boat. Carbon follows a second route, downward, in a snowfall of dead cells and faecal pellets that feeds the deep sea and keeps a large part of the planet’s carbon out of the air. Both routes are now being altered by people, and the unit ends with what the first seven units add up to and with the parts of the ocean that nobody has measured yet.
1 Energy flow through the food web
Every organism in the sea occupies a position in the flow of energy. The trophic level of an organism counts the number of feeding steps between it and the sunlight: the phytoplankton, which make their own food by photosynthesis, are trophic level 1, the herbivores that eat them are level 2, the carnivores that eat the herbivores are level 3, and so on. A chain of such steps is a food chain, and the classic marine example runs from diatoms through copepods to herring to cod to seals. Real feeding is rarely so tidy. A herring eats copepods, krill, and fish larvae, a cod eats herring but also crabs and worms, and a right whale eats copepods directly, which places it two steps lower in the chain than the seal, so that the chains join into a food web like the one in Figure 1. Because most animals feed at more than one level, an animal’s trophic level is usually a fraction. The convention is that a consumer stands one step above the average trophic level of its food, weighted by the share of each food in its diet, so that a fish which eats half copepods (level 2) and half small fish (level 3) stands at level 3.5. The online databases FishBase and SeaLifeBase compute trophic levels in this way from the published diets of the species, and they give the herring a trophic level of 3.4, the Atlantic cod 4.1, and the bluefin tuna 4.5.
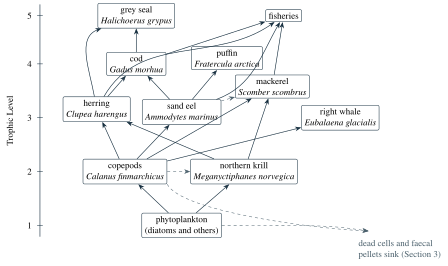
Most of the energy that enters a trophic level never reaches the next one. Of the food an animal eats, a part passes through its gut undigested and leaves as faeces, a larger part is burnt in respiration to power swimming, feeding, and growing, and only the remainder is built into new tissue, which is the only part the next trophic level can eat. Animals that die without being eaten remove their energy from the food web as well. The American ecologist Raymond Lindeman (1915-1942) was the first to measure this loss for a whole lake and everything living in it, and the excursion below tells his story. The rule of thumb that grew out of his work and out of many later measurements in lakes and seas is that about a tenth of the production of one trophic level becomes production of the next.
The rule can be written as a formula. If \(P_1\) is the primary production of the phytoplankton, measured in grams of carbon per square metre per year as in Unit 3, and \(\mathrm{TE}\) is the transfer efficiency written as a fraction, the production available at trophic level \(n\) is \begin{equation} P_n = P_1\,\mathrm{TE}^{\,n-1} . \label{eq:levels} \end{equation} Each additional step multiplies the production by the transfer efficiency once more, so with \(\mathrm{TE} = 0.1\) the production at level 4 is a thousandth of the primary production, and the production at level 5 a ten-thousandth. This is the reason top predators are rare. A sea that fixes 100 grams of carbon under each square metre in a year can build only about a tenth of a gram of cod, measured as carbon, under the same square metre. A bluefin tuna of 200 kilograms feeds half a trophic level higher still, at level 4.5, where the same sea produces \(100\times0.1^{3.5}\) grams of carbon per square metre per year. Because 0.1 to the power 3.5 is 0.1 cubed times the square root of 0.1, which is about 0.0003, this is about 0.03 grams of carbon per square metre per year, and it adds up to about half a gram over the fifteen or so years of the tuna’s growth. A fish is about a tenth carbon by weight, so this one holds about 20 kilograms, or 20,000 grams, of carbon, and 20,000 grams divided by half a gram per square metre means that the sea has spent the whole production of level 4.5 from about 40,000 square metres, which is 4 hectares or roughly six football pitches, on one fish.